Skip to content

spectroscopysh.com

    spectroscopysh.com
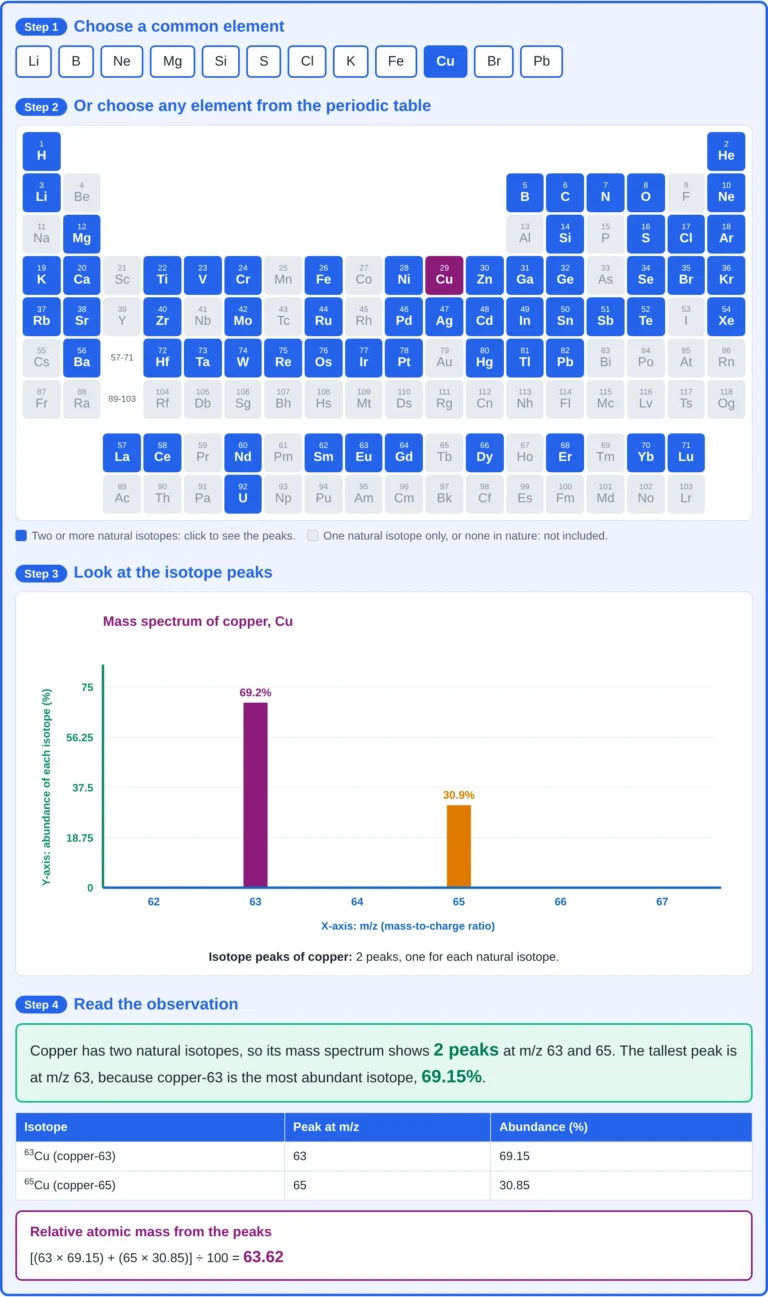
    • Isotope Abundance Calculator set to copper, showing the periodic table, two isotope peaks at m/z 63 and 65, and the relative atomic mass
      Mass Spectrometry | Mass Spectrometry Calculators

      Isotope Peaks in the Mass Spectrum of an Element (Neon, Boron, Magnesium and Copper)

      ByDr. Shammas Din October 11, 2026

      Why does chlorine give two peaks and fluorine only one? Choose any element and see its isotope peaks. Try the Calculator 1. What Is an Isotope Peak? An isotope peak is a peak in the mass spectrum given by one isotope of an element. An element with two isotopes gives two peaks, and an element…

      Read More Isotope Peaks in the Mass Spectrum of an Element (Neon, Boron, Magnesium and Copper)Continue

    • Mass Spectrometry | Chemistry Calculators | Mass Spectrometry Calculators

      Isotopes of Elements Calculator: Natural Isotope Abundance and Relative Atomic Mass of the Elements

      ByDr. Shammas Din October 11, 2026October 18, 2026

      Isotopes of the Elements Calculator: Isotope Peaks in the Mass Spectrum What it is for: this calculator shows the mass spectrum of a single element. It covers the elements that have two or more natural isotopes, and draws one peak for each isotope, gives the percentage of each isotope, and works out the relative atomic…

      Read More Isotopes of Elements Calculator: Natural Isotope Abundance and Relative Atomic Mass of the ElementsContinue

    • Mass Spectrometry

      How to Identify Chlorine and Bromine in an Organic Molecule: M+2 Peak in Mass Spectrometry

      ByDr. Shammas Din October 11, 2026October 11, 2026

      What changes appear in a mass spectrum when chlorine or bromine is present? Change the atoms (chlorine or bromine). Watch the M, M+2 and M+4 peaks change with the help of the calculator. Try the Calculator 1. What Is the M+2 Peak? The M+2 peak in mass spectrometry is the peak that appears two m/z…

      Read More How to Identify Chlorine and Bromine in an Organic Molecule: M+2 Peak in Mass SpectrometryContinue

    • Chemistry Calculators | Mass Spectrometry Calculators

      M+2 and M+4 Peak Calculator: Isotope Pattern of Chlorine, Bromine and Sulfur Compounds

      ByDr. Shammas Din October 11, 2026October 11, 2026

      Isotope Pattern of the Molecular Ion Peak: Chlorine, Bromine and Sulfur This calculator shows the isotope pattern of the molecular ion peak in a mass spectrum when a compound contains chlorine, bromine or sulfur. Choose the number of atoms, and it draws the M, M+2, M+4 and M+6 peaks and gives the ratio of their…

      Read More M+2 and M+4 Peak Calculator: Isotope Pattern of Chlorine, Bromine and Sulfur CompoundsContinue

    • Mass spectrum interpretation: the 2-hexanone spectrum with molecular ion M+ at m/z 100 and base peak at m/z 43, chlorine and bromine M+2 isotope patterns of 3:1 and 1:1, the McLafferty peak at m/z 58, and the nitrogen rule with aniline (M = 93)
      Mass Spectrometry

      Mass Spectrum Interpretation: What Information Can Be Obtained from a Mass Spectrum?

      ByDr. Shammas Din October 10, 2026November 6, 2026

      1. What Is a Mass Spectrum? Every organic compound, when ionised inside a mass spectrometer, breaks apart in its own characteristic way, and the mass spectrum is the record of that event. A mass spectrum is a simple bar graph: the position of each peak gives the mass-to-charge ratio (m/z) of an ion, and its…

      Read More Mass Spectrum Interpretation: What Information Can Be Obtained from a Mass Spectrum?Continue

    Page navigation

    Previous PagePrevious 1 2 3

    © 2026 spectroscopysh.com - WordPress Theme by Kadence WP