Skip to content

spectroscopysh.com

    spectroscopysh.com
    • high resolution mass spectrometry, HRMS, HR-EIMS, mass spectrometry, low resolution vs high resolution, exact mass, same m/z, m/z 29, formyl cation, ethyl cation, CHO+, C2H5+, molecular formula, m/z 100, C6H12O, m/z 43, acylium ion, iodoform test, methyl ketone
      Mass Spectrometry | Chemistry Calculators | Mass Spectrometry Calculators

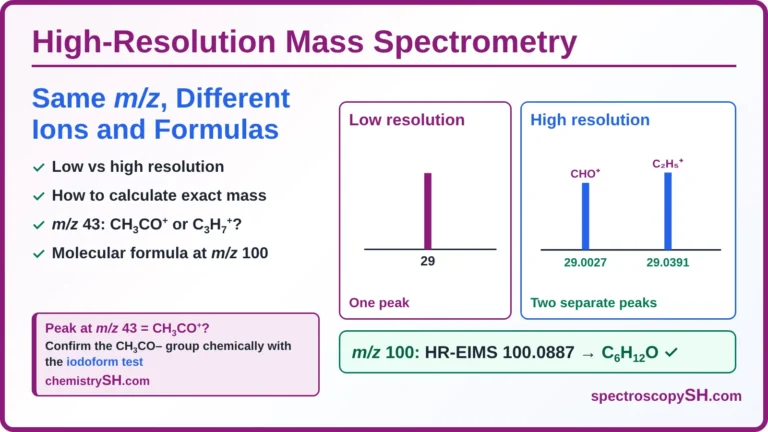
      High-Resolution Mass Spectrometry: How to Tell Apart Ions and Compounds with the Same m/z

      ByDr. Shammas Din October 18, 2026October 28, 2026

      Try It Yourself: Find the Molecular Formula at m/z 114 Problem A compound shows its molecular ion peak, M+•, at m/z 114. The HR-EIMS spectrum gives an exact mass of 114.0682. These five molecular formulas all have a mass of 114: C8H18C6H14N2C7H14OC5H10N2OC6H10O2 Which one is the molecular formula? Calculate the exact masses manually with the…
      Read More High-Resolution Mass Spectrometry: How to Tell Apart Ions and Compounds with the Same m/zContinue

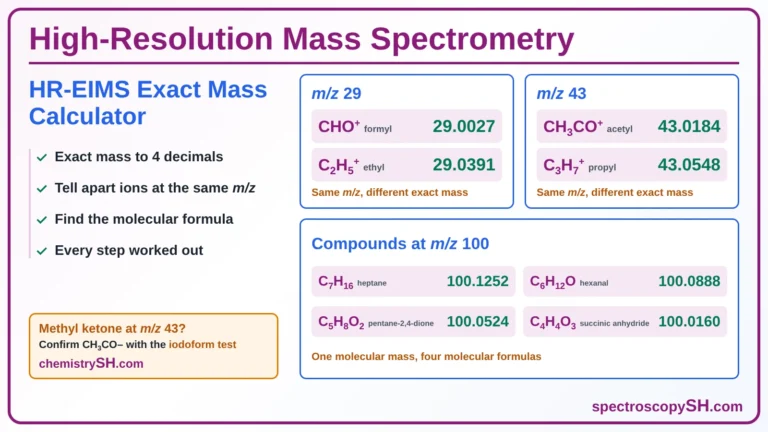
    • HR-EIMS exact mass calculator: CHO+ and C2H5+ at m/z 29, CH3CO+ and C3H7+ at m/z 43, four compounds at m/z 100, and the iodoform test for methyl ketones
      Mass Spectrometry | Chemistry Calculators | Mass Spectrometry Calculators

      Exact Mass Calculator: Find the Molecular Formula from High-Resolution m/z

      ByDr. Shammas Din October 17, 2026October 27, 2026

      بِسْمِ اللَّهِ الرَّحْمَنِ الرَّحِيمِ Bismillāhi r-Raḥmāni r-Raḥīm In the name of Allah, the Most Gracious, the Most Merciful HR-EIMS Exact Mass Calculator Tell Apart Fragments and Formulas That Have the Same m/z ▼ Use the calculator ▶ How to use it 1 of 7 · Two options 1 · Same m/z2 · Formula → exact…

      Read More Exact Mass Calculator: Find the Molecular Formula from High-Resolution m/zContinue

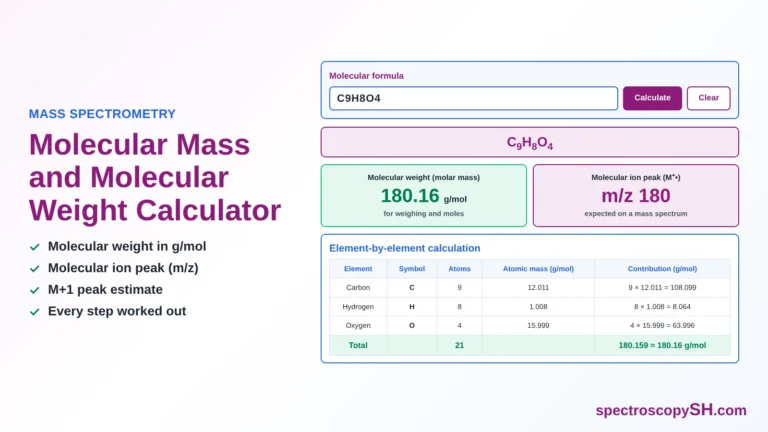
    • Molecular mass and molecular weight calculator showing aspirin C9H8O4: molecular weight 180.16 g/mol and molecular ion peak m/z 180
      Mass Spectrometry | Chemistry Calculators | Mass Spectrometry Calculators

      Molecular Mass Calculator: Molecular Weight of Compounds and Fragment Ions

      ByDr. Shammas Din October 17, 2026October 27, 2026

      بِسْمِ اللَّهِ الرَّحْمَنِ الرَّحِيمِ Bismillāhi r-Raḥmāni r-Raḥīm In the name of Allah, the Most Gracious, the Most Merciful Molecular Mass Calculator Find the Molecular Weight and the Molecular Ion Peak of a Compound from Its Formula ▼ Use the calculator ▶ How to use it 1 of 5 · Type a formula C9H8O4 Calculate or…

      Read More Molecular Mass Calculator: Molecular Weight of Compounds and Fragment IonsContinue

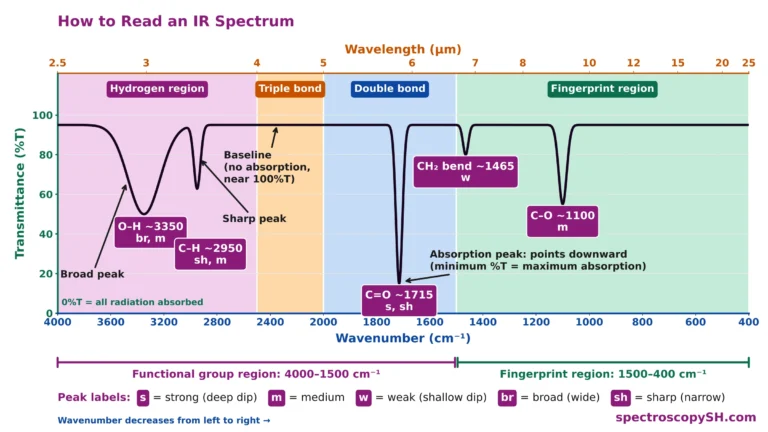
    • Infrared Spectroscopy: IR Spectrum Interpretation, How to Read an IR Spectrum and Identify Functional Groups
      Infrared Spectroscopy

      Infrared Spectroscopy: IR Spectrum Interpretation, How to Read an IR Spectrum and Identify Functional Groups

      ByDr. Shammas Din October 15, 2026October 20, 2026

      Infrared spectrum interpretation is reading the absorption peaks of an IR spectrum — their position (wavenumber, cm⁻¹), intensity and shape — to identify the bonds and functional groups present in a molecule. This guide explains how to read the axes of an IR spectrum, the four regions where different bonds absorb, and a step-by-step method…

      Read More Infrared Spectroscopy: IR Spectrum Interpretation, How to Read an IR Spectrum and Identify Functional GroupsContinue

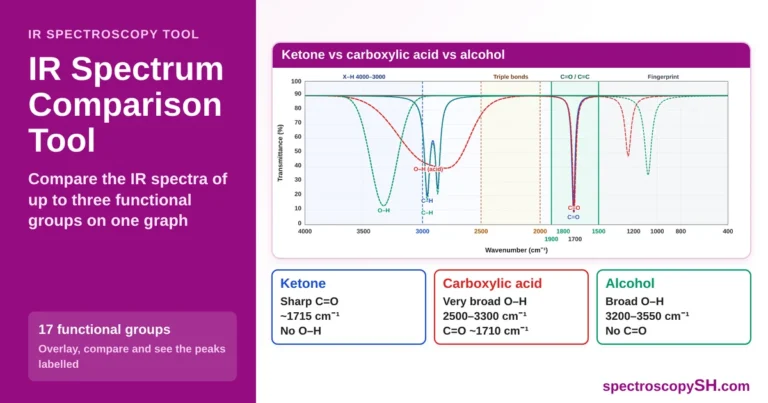
    • IR spectrum comparison tool featured image showing the IR spectra of a ketone, a carboxylic acid and an alcohol on one graph, with their O–H and C=O peaks compared
      Infrared Spectroscopy | Infrared Spectroscopy Tool

      Infrared Spectrum Comparison Tool: Compare IR Spectra of Functional Groups

      ByDr. Shammas Din October 15, 2026October 20, 2026

      Infrared Spectroscopy: IR Spectrum Comparison Tool Compare the IR Spectra of Functional Groups on One Graph How to use it Select a compound in each column: Compound 1 (blue), Compound 2 (red) and, if you want, Compound 3 (green). Press Compare on Spectrum to draw their spectra together on one graph. See where the peaks…

      Read More Infrared Spectrum Comparison Tool: Compare IR Spectra of Functional GroupsContinue

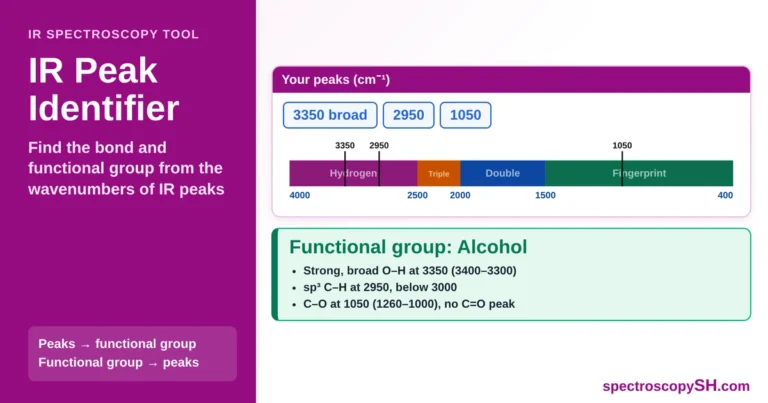
    • Functional group identifier featured image showing IR peaks at 3350 (broad), 2950 and 1050 cm⁻¹ on the four regions of an IR spectrum, identified as an alcohol
      Chemistry Calculators | Infrared Spectroscopy | Infrared Spectroscopy Tool

      Infrared Spectroscopy: IR Peak Identifier; Functional group Detection

      ByDr. Shammas Din October 15, 2026October 20, 2026

      This functional group identifier finds the bond and functional group from the wavenumbers of the peaks in an IR spectrum, and shows the expected peaks of any functional group. Infrared Spectroscopy: IR Peak Identifier Find the Bond and Functional Group from the Wavenumber of an IR Peak How to use it From wavenumbers to functional…

      Read More Infrared Spectroscopy: IR Peak Identifier; Functional group DetectionContinue

    • McLafferty rearrangement in mass spectrometry: six-membered transition state, McLafferty ion m/z values for aldehydes, ketones, carboxylic acids, esters and amides, and 2-pentanone with its gamma hydrogen giving the McLafferty ion at m/z 58
      Mass Spectrometry

      McLafferty Rearrangement in Mass Spectrometry: Mechanism with Examples of Ketones, Esters and Carboxylic Acids

      ByDr. Shammas Din October 14, 2026October 27, 2026

      Where does the McLafferty peak appear for your compound? Choose a ketone, aldehyde, ester or acid and see its McLafferty ion and m/z value.    Try the Calculator    1. What Is the McLafferty Rearrangement? The McLafferty rearrangement is a type of fragmentation in mass spectrometry in which a molecular ion moves a hydrogen atom from its…

      Read More McLafferty Rearrangement in Mass Spectrometry: Mechanism with Examples of Ketones, Esters and Carboxylic AcidsContinue

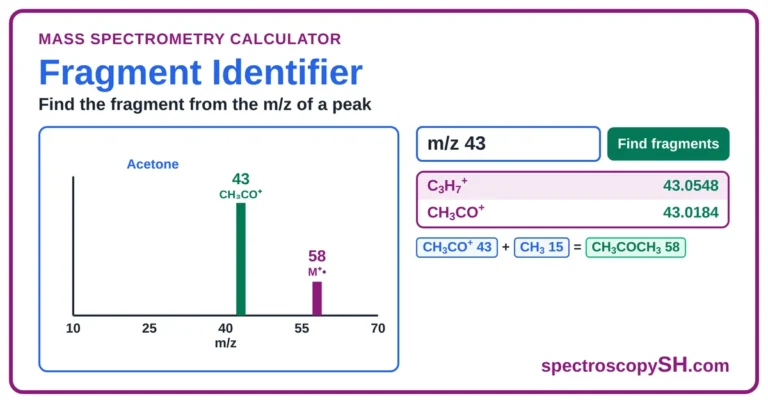
    • Mass spectrum fragment identifier calculator showing the acetone mass spectrum with peaks at m/z 43 and 58, the fragments C3H7+ and CH3CO+ with their exact masses
      Mass Spectrometry | Chemistry Calculators | Mass Spectrometry Calculators

      Mass Spectrum Fragment Identifier: Find the Fragment Ion from Its m/z Value

      ByDr. Shammas Din October 14, 2026October 27, 2026

      Mass Spectrum Fragment Identifier: Find the Fragment from the m/z of a Peak What it is for: start with the m/z value of a peak, and this tool finds the fragment ions with that mass, with their formulas, names and exact masses. Or type the molecular ion peak and a fragment peak, and it tells…

      Read More Mass Spectrum Fragment Identifier: Find the Fragment Ion from Its m/z ValueContinue

    • Fragmentation patterns in mass spectrometry calculator showing the mass spectrum of 2-pentanone with peaks at m/z 43, 58, 71 and 86
      Mass Spectrometry | Chemistry Calculators | Mass Spectrometry Calculators

      Fragmentation Pattern Finder: Common Fragment Ions by Compound Class

      ByDr. Shammas Din October 14, 2026October 27, 2026

      Fragmentation Patterns in Mass Spectrometry: Common Fragments of Each Compound Class What it is for: choose a compound class, and this tool shows the peaks and losses to expect in its mass spectrum, a drawn spectrum of an example compound with every peak explained, and the expected peaks of more compounds of the same class….

      Read More Fragmentation Pattern Finder: Common Fragment Ions by Compound ClassContinue

    • Mass Spectrometry | Chemistry Calculators | Mass Spectrometry Calculators

      McLafferty Rearrangement Calculator: Find the McLafferty Ion m/z of Any Compound

      ByDr. Shammas Din October 13, 2026November 6, 2026

      McLafferty Rearrangement Calculator: McLafferty Ion, Mechanism and Mass Spectrum What it is for: choose a compound class and a compound, and this calculator shows its molecular ion, its McLafferty ion (or why it has none), the neutral alkene lost, the mechanism in four stages, the mass calculation and a schematic mass spectrum. How to use…

      Read More McLafferty Rearrangement Calculator: Find the McLafferty Ion m/z of Any CompoundContinue

    Page navigation

    Previous PagePrevious 1 2 3 Next PageNext

    © 2026 spectroscopysh.com - WordPress Theme by Kadence WP