Infrared Spectroscopy: IR Spectrum Interpretation, How to Read an IR Spectrum and Identify Functional Groups
Infrared spectrum interpretation is reading the absorption peaks of an IR spectrum — their position (wavenumber, cm⁻¹), intensity and shape — to identify the bonds and functional groups present in a molecule. This guide explains how to read the axes of an IR spectrum, the four regions where different bonds absorb, and a step-by-step method to identify functional groups.
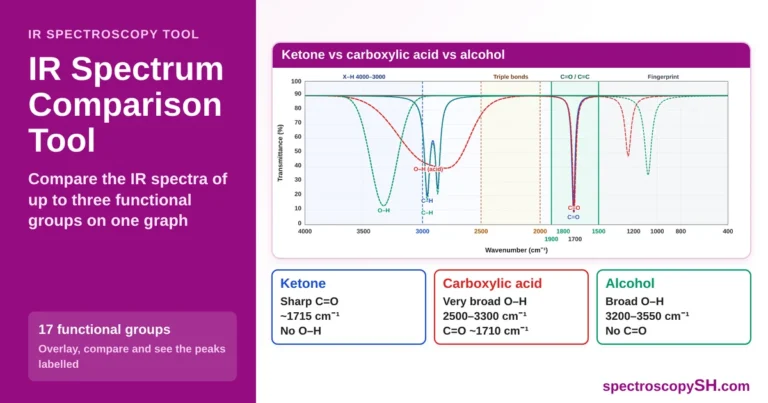
Compare IR Spectra on One Graph
Choose up to three functional groups and see where their peaks overlap and where they differ.
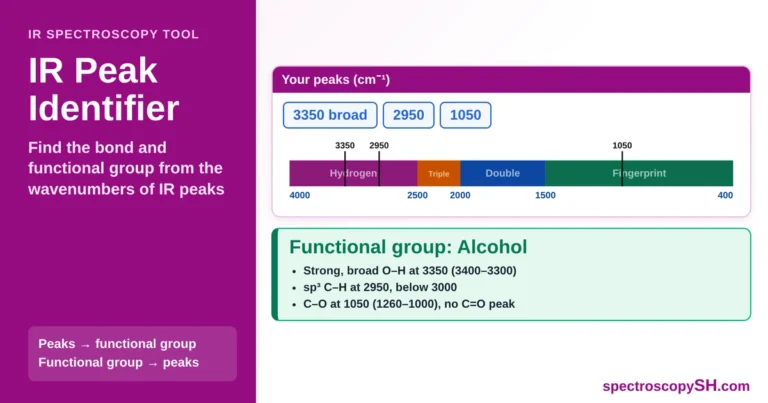
Find the Functional Group of Any IR Peak
Type the wavenumber of a peak and find its bond and functional group, or press a functional group to see where it absorbs.
IR Spectrum Interpretation Series
- How to Read an IR Spectrum (this page)
- Hydrogen Region
- Triple Bond Region
- Double Bond Region
- Fingerprint Region
- Worked Examples and Common Mistakes
How to Read an IR Spectrum: X-Axis and Y-Axis
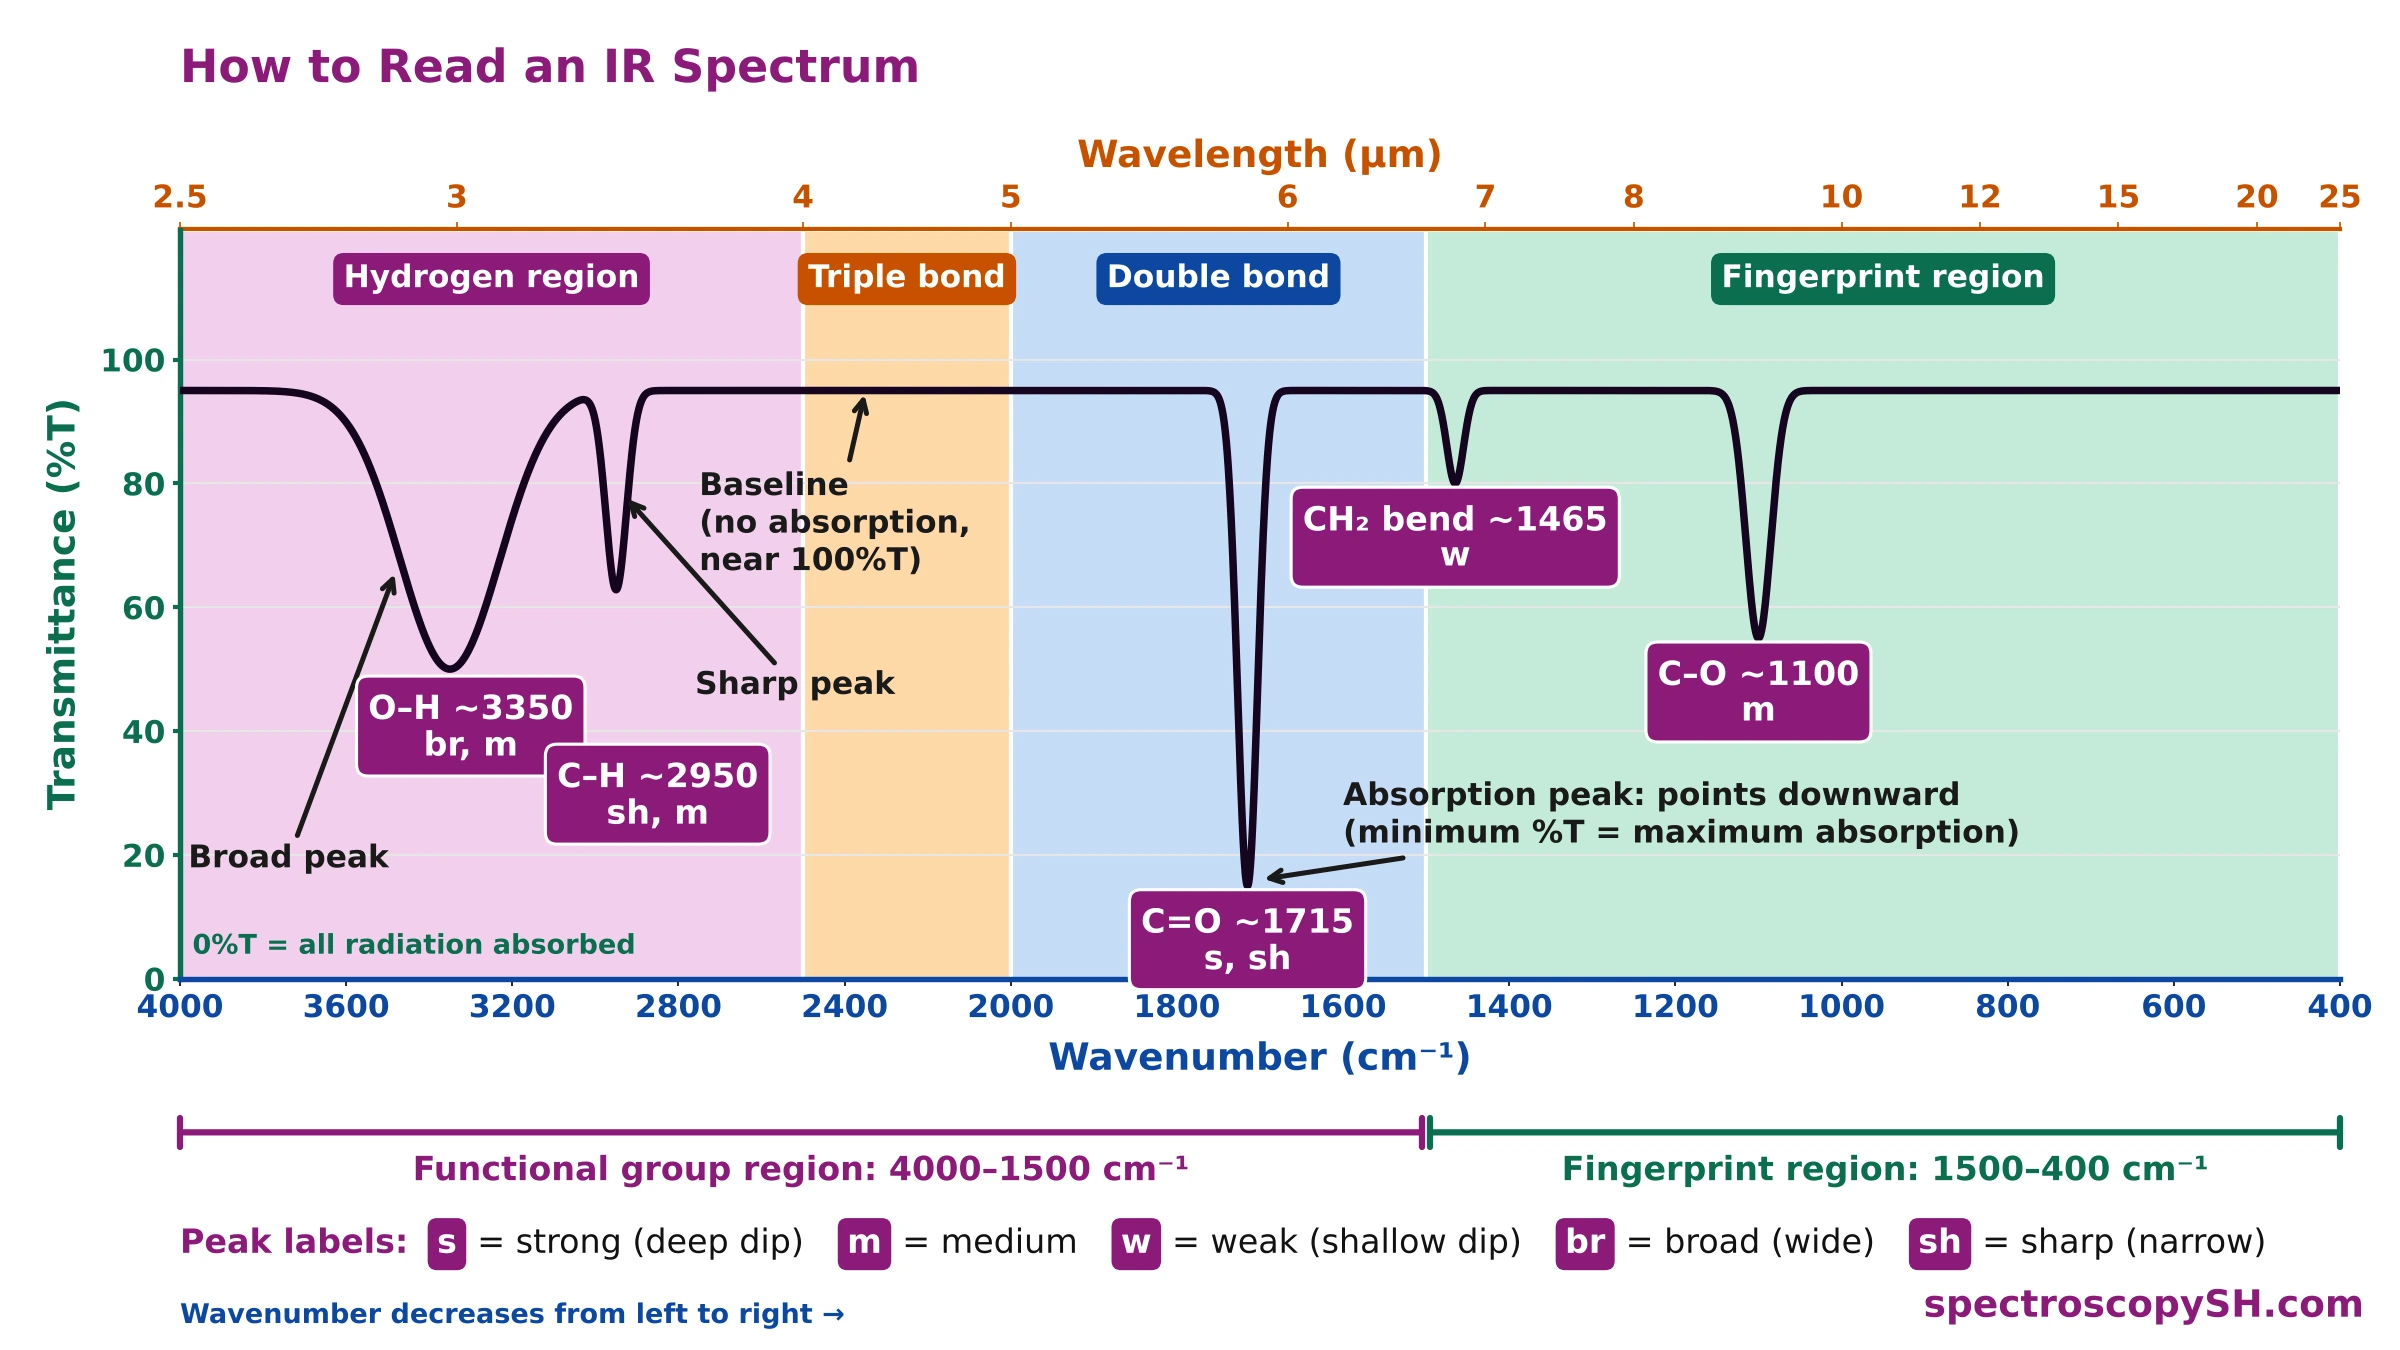
An IR spectrum plots percent transmittance (%T, y-axis) against wavenumber (cm⁻¹, x-axis). Each downward dip is an absorption peak: the deeper the dip, the more infrared radiation the bond absorbs.
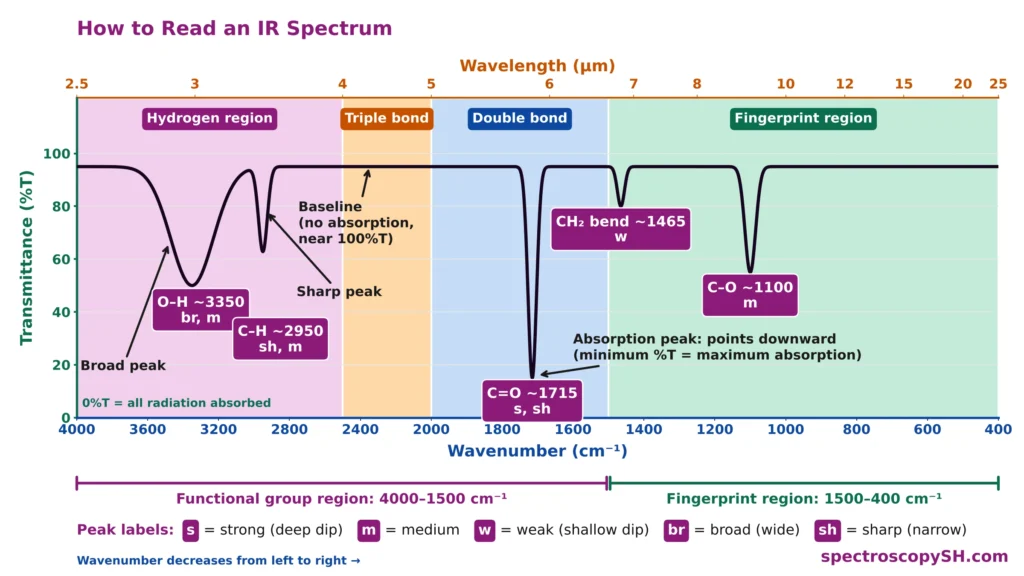
- X-axis (bottom), wavenumber: from 4000 cm⁻¹ on the left to 400 cm⁻¹ on the right; a higher wavenumber means a higher energy.
- X-axis (top), wavelength: 2.5–25 µm; wavenumber (cm⁻¹) = 10,000 / wavelength (µm), so 1715 cm⁻¹ = 5.83 µm.
- Y-axis, percent transmittance (%T): 100%T is the baseline (no absorption); 0%T means all the radiation is absorbed.
- Peaks point downward: on an absorbance (A) plot they point upward, but each peak stays at the same wavenumber.
- Peak labels: s, m, w = strong, medium, weak; br = broad; sh = sharp. “1715 cm⁻¹ (s)” means a strong peak at 1715 cm⁻¹.
What Information Can Be Obtained from an IR Spectrum?
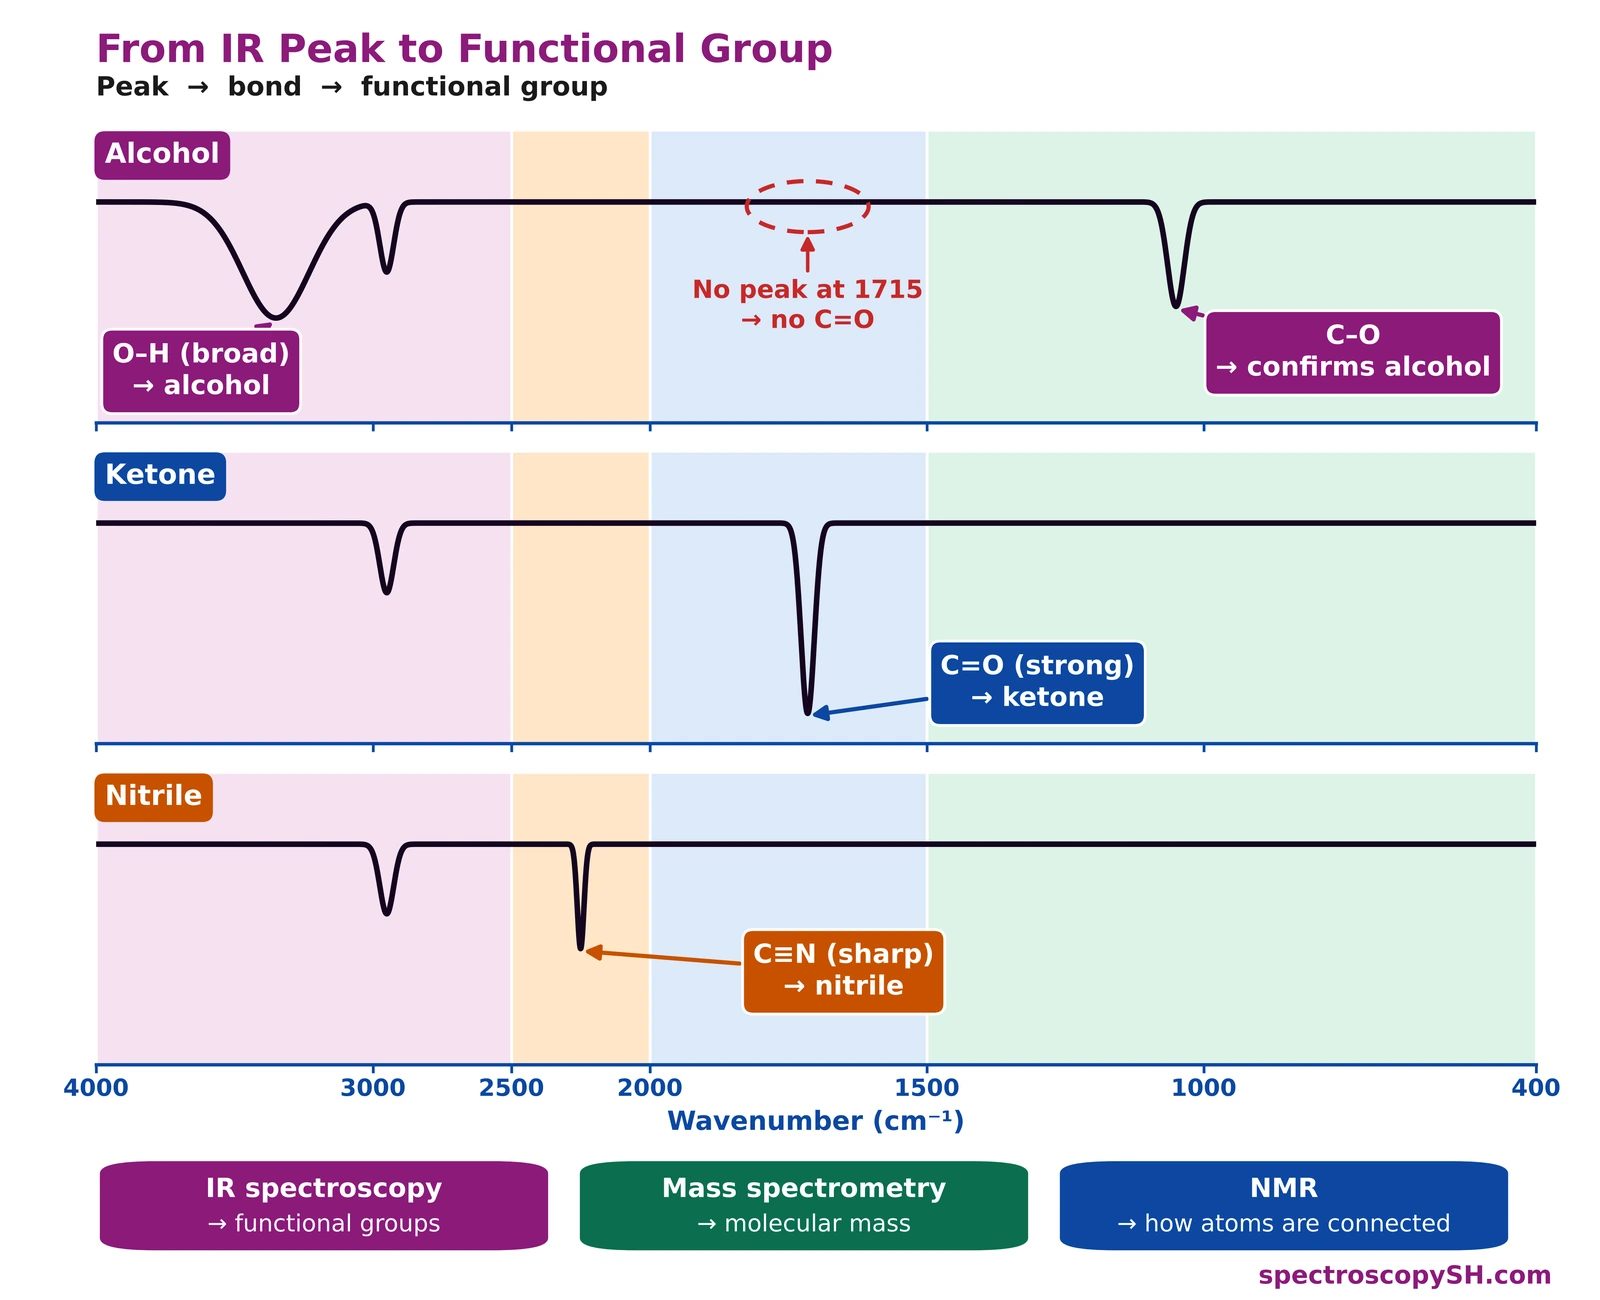
An IR spectrum shows a series of absorption bands. From the position (wavenumber, cm⁻¹), strength (strong, medium or weak) and shape (broad or sharp) of each band, we deduce which bonds are present, and from those bonds, which functional groups the molecule contains. For example, an O–H band means an alcohol or a carboxylic acid: if a C=O band is also present, it is a carboxylic acid; if not, it is an alcohol (or a phenol).
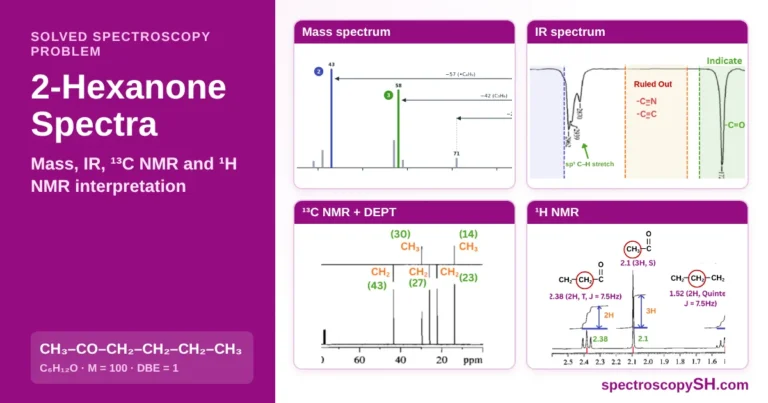
The IR spectra below of an alcohol, a ketone and a nitrile show how one band identifies each functional group.
What Bonds Can Be Detected in an IR Spectrum?
Functional group region (zones 1–3, 4000–1500 cm⁻¹): identifies the functional groups.
Fingerprint region (zone 4, 1500–400 cm⁻¹): confirms the compound.
The Four Regions of an IR Spectrum
An IR spectrum is divided into four regions, read from left to right: the hydrogen region (4000–2500 cm⁻¹), the triple bond region (2500–2000 cm⁻¹), the double bond region (2000–1500 cm⁻¹) and the fingerprint region (1500–400 cm⁻¹). The first three make up the functional group region, where functional groups are identified; the fingerprint region confirms the compound.
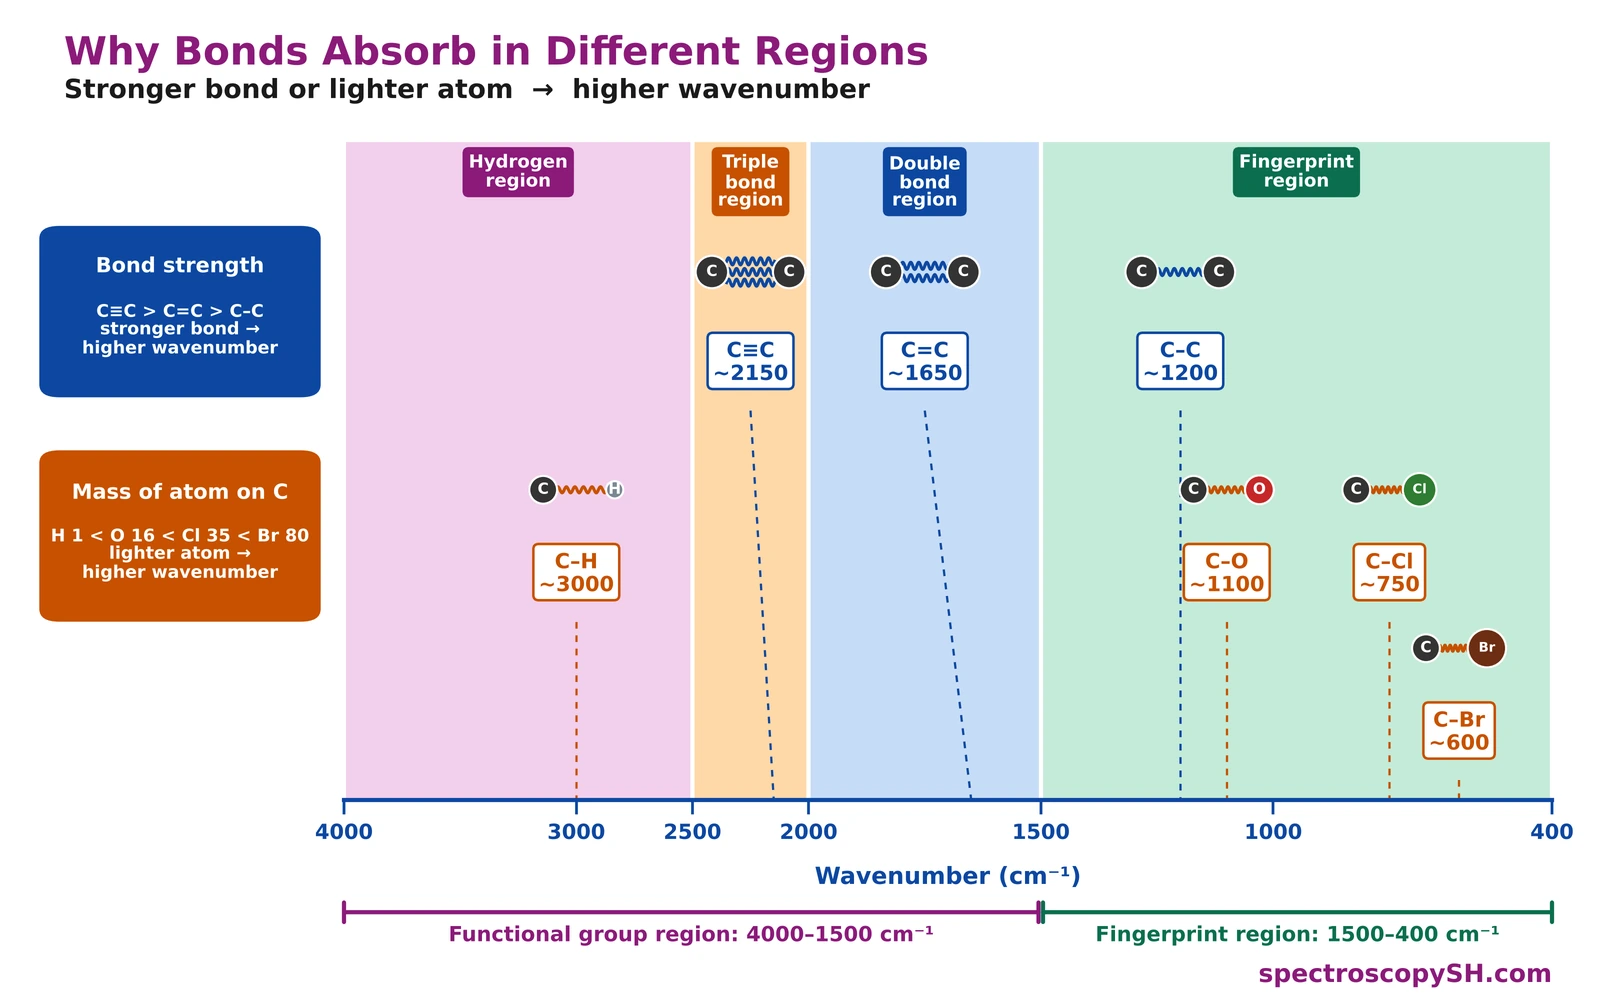
- Stronger bond, higher wavenumber: C≡C > C=C > C–C, so C≡C absorbs at about 2150, C=C about 1650 and C–C about 1200 cm⁻¹.
- Lighter atom on carbon, higher wavenumber: H (1) < O (16) < Cl (35) < Br (80), so C–H absorbs at about 3000, C–O about 1100, C–Cl about 750 and C–Br about 600 cm⁻¹.
- Functional group region (4000–1500 cm⁻¹): few, well-separated peaks; each can be assigned to a bond.
- Fingerprint region (1500–400 cm⁻¹): many overlapping peaks; the whole pattern is unique to each compound.
- IR-active bonds: a bond absorbs only if its dipole moment changes as it vibrates, so polar C=O gives a strong peak, while the symmetrical C≡C of but-2-yne gives none.
What to Look for in Each Region
IR Spectrum Zones and Their Functional Groups
Click (or tap) a zone on the spectrum to see its functional groups and absorption values.
Zone 1 — Hydrogen (X–H) Region
4000–2500 cm⁻¹
Key question: Is there an O–H or N–H bond, and what kind of C–H is present?
Bonds between hydrogen and another atom absorb here. Hydrogen is the lightest atom, so these bonds vibrate fastest and appear on the far left.
- O–H (alcohol, phenol): 3400–3300 cm⁻¹, broad
- O–H (carboxylic acid): 3400–2400 cm⁻¹, very broad, overlaps C–H
- N–H (primary amine): 3500–3300 cm⁻¹, two bands
- N–H (secondary amine): 3500–3300 cm⁻¹, one band
- N–H (primary amide): about 3350 and 3180 cm⁻¹, two bands
- N–H (secondary amide): about 3300 cm⁻¹, one band
- ≡C–H (terminal alkyne): about 3300 cm⁻¹
- =C–H (alkene, aromatic): 3095–3010 cm⁻¹
- C–H (alkane (sp³)): 3000–2840 cm⁻¹
- C–H (aldehyde): 2860–2800 and 2760–2700 cm⁻¹, pair of weak bands
- S–H (thiol): about 2550 cm⁻¹, weak
→ Explained in detail in Part 2: Hydrogen Region
Zone 2 — Triple Bond Region
2500–2000 cm⁻¹
Key question: Is there a triple bond?
Few bonds absorb here, so in most spectra this region is empty. An empty region is itself useful: it shows that no triple bond is present.
- C≡N (nitrile): about 2250 cm⁻¹, medium, sharp
- C≡C (alkyne): about 2150 cm⁻¹, weak, sharp; absent if symmetrical
- N=C=O (isocyanate): about 2270 cm⁻¹, broad, intense
Note: a doublet near 2350 cm⁻¹ is CO₂ from the air, not the sample.
→ Explained in detail in Part 3: Triple Bond Region
Zone 3 — Double Bond Region
2000–1500 cm⁻¹
Key question: Is there a C=O group?
The C=O stretch is often the strongest peak in the whole spectrum, and its exact position tells which class of carbonyl compound is present. Conjugation moves C=O to a lower wavenumber.
- C=O (anhydride): 1830–1800 and 1775–1740 cm⁻¹, two bands
- C=O (acid chloride): 1810–1775 cm⁻¹
- C=O (ester): 1750–1735 cm⁻¹
- C=O (aldehyde): 1740–1725 cm⁻¹
- C=O (carboxylic acid): 1730–1700 cm⁻¹
- C=O (ketone): 1720–1708 cm⁻¹
- C=O (amide): 1700–1640 cm⁻¹
- C=N (imine): 1690–1640 cm⁻¹
- C=C (alkene): 1660–1600 cm⁻¹, weak
- C=C (aromatic ring): 1600 and 1475 cm⁻¹, pair of peaks
→ Explained in detail in Part 4: Double Bond Region
Zone 4 — Fingerprint Region
1500–400 cm⁻¹
Key question: Which single bonds confirm the functional group, and does the whole pattern match a reference spectrum?
Single-bond stretches and bending vibrations crowd this region. Individual peaks are hard to assign, but the overall pattern is unique to each compound and confirms its identity by comparison with a reference spectrum.
- C–O (alcohol): 1260–1000 cm⁻¹
- C–O (ether): 1300–1000 cm⁻¹, aliphatic about 1120
- C–O (ester): 1300–1000 cm⁻¹, two or more bands
- C–N (amine): 1350–1000 cm⁻¹
- C–F (fluoride): 1400–1000 cm⁻¹, strong
- C–Cl (chloride): 785–540 cm⁻¹, strong
- C–Br (bromide): 650–510 cm⁻¹, strong
- C–H bend (aromatic): 900–690 cm⁻¹, shows substitution pattern
- C–C (alkane) — not useful for identification
→ Explained in detail in Part 5: Fingerprint Region
Infrared Spectrum Interpretation Step by Step: How to Interpret an IR Spectrum
To interpret an IR spectrum, do not assign every peak. Look for a few major peaks: check C=O first, then its companion peak, then O–H, N–H, C=C and triple bonds.
All values in cm⁻¹ · spectroscopySH.com
Check your answer
Type the peaks of your spectrum, and the tool follows these steps for you.
Functional Group Identifier Tool
Type the wavenumbers of the peaks in your IR spectrum, region by region, and the tool shows the bond under each peak and the most likely functional group. Or press a bond to see where it absorbs.
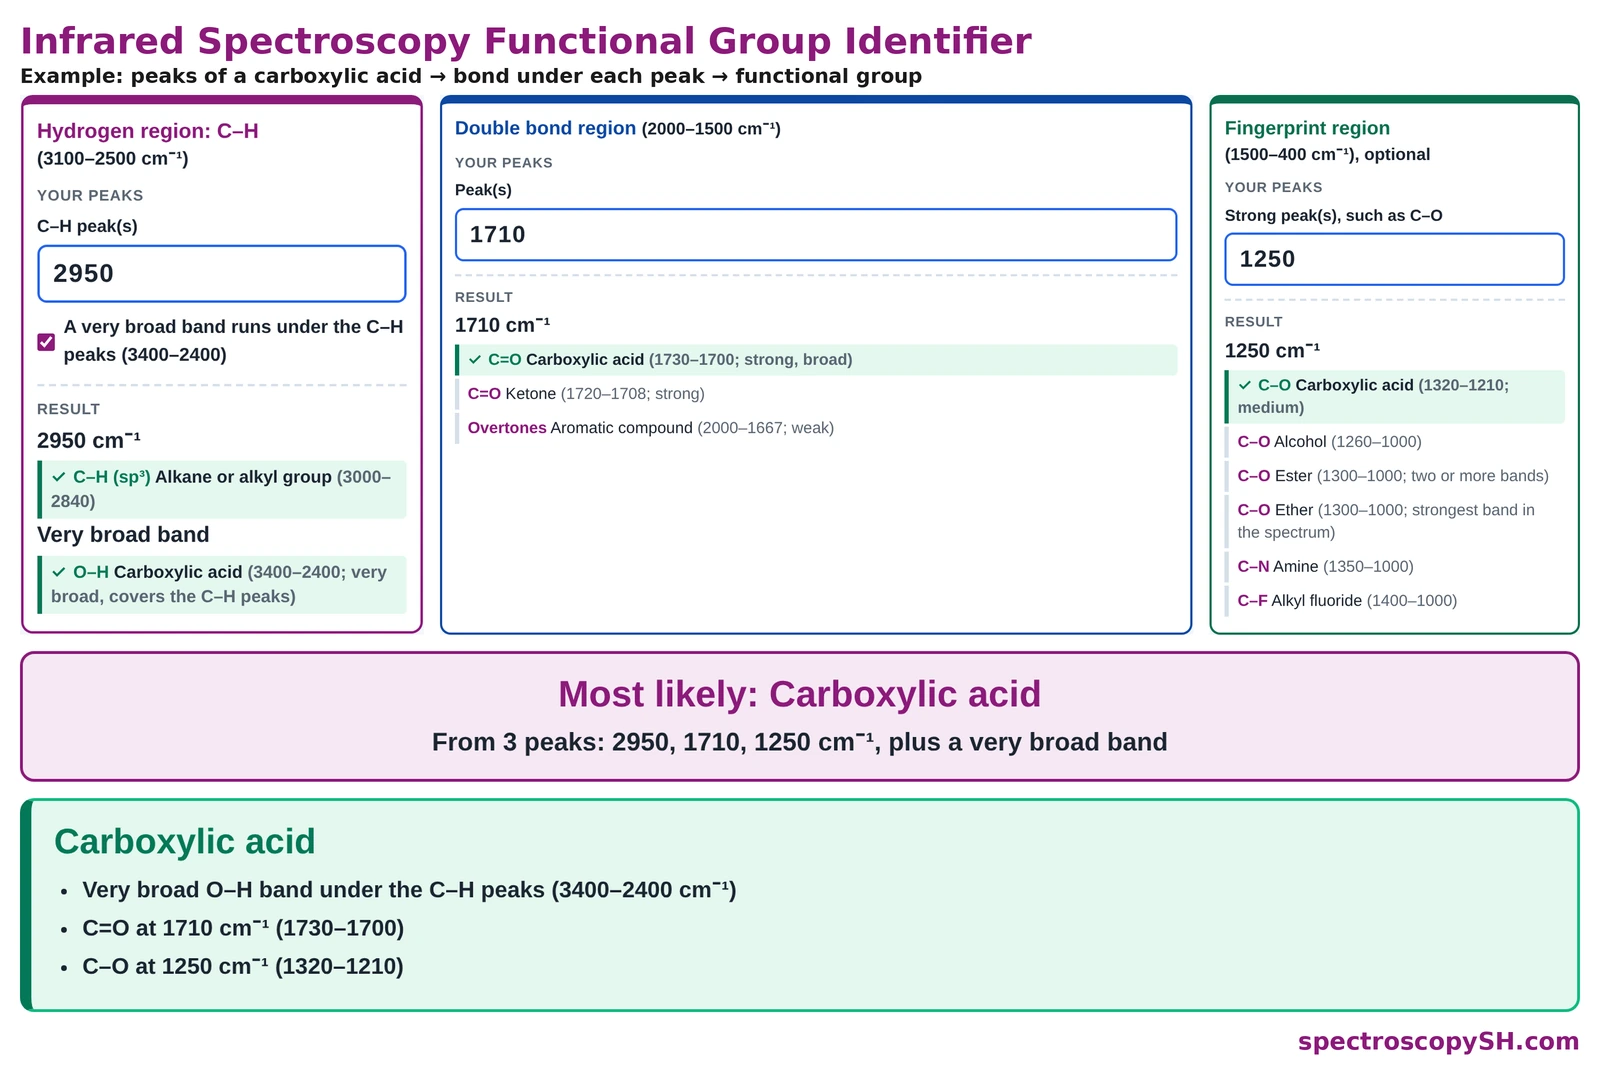
Open the Functional Group Identifier
Compare IR Spectra on One Graph
Choose up to three functional groups and see where their peaks overlap and where they differ.
Key Terms in Infrared Spectrum Interpretation
Absorbance (A)
Absorbance is a measure of how much infrared radiation a sample absorbs, equal to −log T; on an absorbance plot, peaks point upward.
Example: A strong C=O band appears as a tall upward peak on an absorbance spectrum and as a deep downward dip on a transmittance spectrum.
Absorption Band (Peak)
An absorption band is a dip in an IR spectrum where a bond absorbs infrared radiation.
Example: The O–H of an alcohol gives a broad absorption band at 3400–3300 cm⁻¹.
Ball-and-Spring Model
The ball-and-spring model treats a bond as a spring joining two atoms, so that a stronger bond or a lighter atom vibrates at a higher wavenumber.
Example: C≡C absorbs at about 2150 cm⁻¹, higher than C=C at about 1650 cm⁻¹, because the triple bond is stronger.
Baseline
The baseline is the line near 100% transmittance where the sample absorbs no radiation.
Example: In most compounds, the 2500–2000 cm⁻¹ region stays at the baseline because no triple bond is present.
Bending Vibration
A bending vibration is a vibration in which the angle between two bonds changes; it needs less energy than stretching.
Example: CH₃ bending appears near 1375 cm⁻¹, in the fingerprint region.
Broad Peak
A broad peak is a wide, rounded absorption band, usually caused by hydrogen bonding.
Example: The O–H of a carboxylic acid gives a very broad peak from 3400 to 2400 cm⁻¹.
Companion Peak
A companion peak is a second peak used to confirm the class of a functional group.
Example: A C=O peak together with a very broad O–H at 3400–2400 cm⁻¹ shows a carboxylic acid.
Conjugation
Conjugation is the alternation of single and double bonds; it moves the C=O stretch to a lower wavenumber.
Example: A ketone whose C=O is conjugated with a benzene ring absorbs below the 1720–1708 cm⁻¹ of a simple ketone.
Fingerprint Region
The fingerprint region is the part of an IR spectrum from 1500 to 400 cm⁻¹, with many overlapping peaks whose overall pattern is unique to each compound.
Example: Two compounds with the same functional groups show different patterns in the fingerprint region.
Functional Group Region
The functional group region is the part of an IR spectrum from 4000 to 1500 cm⁻¹, where peaks are few, well separated and assignable to functional groups.
Example: The C=O peak of a carbonyl compound, at about 1640–1830 cm⁻¹, lies in the functional group region.
Infrared (IR) Spectrum
An IR spectrum is a graph of how much infrared radiation a compound transmits at each wavenumber, used to identify the bonds in a molecule.
Example: The IR spectrum of a ketone shows a strong C=O peak at 1720–1708 cm⁻¹.
IR-Active Bond
An IR-active bond is a bond whose dipole moment changes as it vibrates, so it absorbs infrared radiation.
Example: C=O is IR active and gives a strong peak, while the symmetrical C≡C of but-2-yne gives no peak.
IR Spectrum Chart (Correlation Chart)
An IR spectrum chart is a table of the wavenumber ranges where each type of bond absorbs.
Example: An IR spectrum chart lists ester C=O at 1750–1735 cm⁻¹.
Percent Transmittance (%T)
Percent transmittance is the percentage of infrared radiation that passes through the sample at a given wavenumber.
Example: A peak that dips to 10%T means that 90% of the radiation at that wavenumber was absorbed.
Reference Spectrum
A reference spectrum is the recorded IR spectrum of a known, pure compound, used for comparison.
Example: If the spectrum of an unknown matches the reference spectrum of phenol peak for peak, the unknown is phenol.
Sharp Peak
A sharp peak is a narrow absorption band.
Example: The C≡N of a nitrile gives a medium, sharp peak near 2250 cm⁻¹.
Stretching Vibration
A stretching vibration is a vibration in which the distance between two bonded atoms increases and decreases.
Example: sp³ C–H stretching appears at 3000–2840 cm⁻¹.
Wavenumber
Wavenumber is the number of waves per centimetre (unit cm⁻¹), plotted on the x-axis of an IR spectrum; it is directly proportional to energy.
Example: A peak at 1715 cm⁻¹ corresponds to a wavelength of 10,000 / 1715 = 5.83 µm.
Confirm the IR result by chemical tests
- CH₃CO– group (methyl ketone): haloform reaction, giving a yellow iodoform precipitate.
- Carboxylic acid or alcohol: esterification reaction, which forms an ester with a fruity smell.
- All functional group tests: reaction types used in organic qualitative analysis.